
Student Demographics and Achievement Rates
Student Population (2020-2021)
There are 186 students enrolled at the University as of July 2021. Below, in Table 1, is a summary of the demographics:
Table 1 – Student Demographics
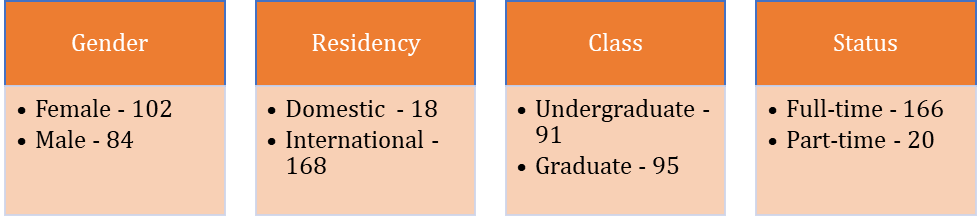
Of the 91 Undergraduate students, approximately 76% (69) are traditional students which means they enroll directly after high school or soon thereafter. Twelve of the eighteen domestic students are non-traditional and a majority of the Undergraduate class is female – 50 of the 91 or ~55%.
At the graduate level, 36 of the 95 (~38%) are professionals between the age of 30 and 58. This is significant as it sheds light on the students’ motivation and commitment to completing their coursework as part of their professional development. Further, 33 (~35%) have professional experience after completing their bachelor’s degree but are enrolled full-time, and between the age of 26 and 29. Interestingly, 26 (~27%) started their graduate studies directly after completing their bachelor’s degree and are between the age of 22 and 25.
BAU student body is highly diverse, and the students represent different parts of the world:
Africa: 5% Asia: 65% Europe: 7% Latin America: 10%
North America: 10% Middle East: 3%
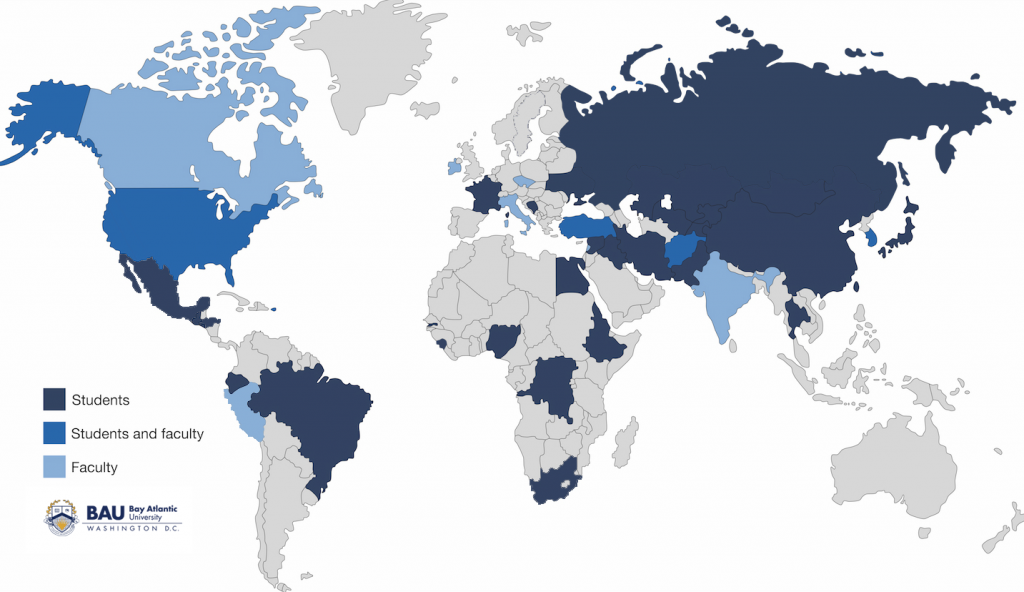
Above: map of countries represented by BAU students and faculty
Achievement Rates
The below data was reported to ACICS by BAU in its most recent “Campus Accountability Report“
- The Retention Rate is defined by ACICS in terms of the total student enrollment, minus those students who withdraw, divided by the total student enrollment and expressed as a percent. The retention rate is calculated at both the program and campus levels, based upon data submitted for the annual Campus Accountability Report (CAR) and according to the detailed formula and terms defined in the Guidelines and Instructions for the Campus Accountability Report, which is available on the ACICS website. The detailed formula includes definitions, adjustments, and exclusions for calculating total enrollment and withdrawals.
- The Placement Rate is defined by ACICS in terms of the total number of completers and graduates minus those who are not placed (employed), divided by the total number of completers and graduates, and expressed as a percent. The placement rate is calculated at both the program and campus levels, based upon data submitted for the annual Campus Accountability Report (CAR) and according to the detailed formula and terms defined in the Guidelines and Instructions for the Campus Accountability Report, which is available on the ACICS website. The detailed formula includes definitions of placed adjustments, and exclusions for students not available for placement.
2021 Campus Level Standards
| Campus Retention Rate | 91% |
| Campus Placement Rate | 83% |
2021 Program Level Standards
| Program Name | Retention | Placement |
| Accounting (Bachelor’s Degree) | 83% | N/A |
| Business Administration and Management (Bachelor’s Degree) | 89% | N/A |
| Economics and Finance (Bachelor’s Degree) | 100% | N/A |
| Master of Business Administration | 92% | 82% |
| Political Science and International Relations (Bachelor’s Degree) | 90% | 100% |
| Big Data Analytics (Master’s Degree) | 100% | N/A |
| Cyber Security (Master’s Degree) | 100% | N/A |
| Data Science (Bachelor’s Degree) | 71% | N/A |
| Information Technology (Bachelor’s Degree) | 80% | N/A |
2020 Campus Level Standards
| Campus Retention Rate | 87% |
| Campus Placement Rate | 86% |
2020 Program Level Standards
| Program Name | Retention | Placement |
| Accounting (Bachelor’s Degree) | 100% | N/A |
| Business Administration and Management (Bachelor’s Degree) | 88% | 100% |
| Economics and Finance (Bachelor’s Degree) | 82% | 100% |
| Master of Business Administration | 86% | 75% |
| Political Science and International Relations (Bachelor’s Degree) | 77% | 100% |
| Big Data Analytics (Master’s Degree) | 100% | N/A |
| Cyber Security (Master’s Degree) | 100% | N/A |
| Data Science (Bachelor’s Degree) | 100% | N/A |
| Information Technology (Bachelor’s Degree) | 100% | N/A |
2019 Campus Level Standards
| Campus Retention Rate | 80% |
| Campus Placement Rate | 76% |
| Campus Level Graduation Rate | 91% |
2019 Program Level Standards
| Program Name | Retention | Placement |
| Accounting (BA Degree) | 100% | N/A |
| Business Administration and Management (BA Degree) | 73% | N/A |
| Economics and Finance (BA Degree) | 91% | N/A |
| Master of Business Administration | 81% | 75% |
| Political Science and International Relations (BA Degree) | 72% | 100% |
2018 Campus Level Standards
| Campus Retention Rate | 88% |
| Campus Placement Rate | 76% |
| Campus Graduation Rate | 83% |
2018 Program Level Standards
| Program Name | Retention | Placement |
| Accounting (BA Degree) | 100% | N/A |
| Business Administration and Management (BA Degree) | 100% | N/A |
| Economics (BA Degree) | 93% | N/A |
| International Relations and Affairs (BA Degree) | 100% | N/A |
| Master of Business Administration | 96% | 76% |
*For more information or to arrange a visit, please contact our Admission team at admissions@bau.edu